Overview: Decoding the Body's Data
In the modern health landscape, we are drowning in data but starving for insight. Most people check their step count and call it a day, yet a 10,000-step goal is an arbitrary figure rooted in 1960s marketing rather than physiological necessity. To truly understand your health, you must look at biometric trends rather than isolated snapshots.

In my years analyzing health data, I’ve found that the most vital metrics are those that reflect the efficiency of your autonomic nervous system and your metabolic flexibility. For example, a resting heart rate (RHR) that creeps up by 5 beats per minute over a week isn't just a fluke—it’s often an early warning sign of systemic inflammation or overtraining before physical symptoms appear.
According to a 2023 study published in the Journal of Personalized Medicine, individuals who actively monitored personalized health metrics via digital tools saw a 15% improvement in blood pressure management compared to those receiving standard care. Data transforms "feeling fine" into "knowing you're optimized."
Pain Points: The Misinterpretation Trap
The biggest hurdle in health tracking isn't a lack of tools; it’s the misalignment of context. Users often treat wearable data as gospel without understanding the margin of error.
Obsessing Over Raw Numbers
Many users experience "orthosomnia"—anxiety caused by trying to achieve a perfect sleep score on a tracker. They see a "70" on their Oura Ring or Garmin and immediately feel tired, regardless of how they actually feel. This disconnect creates psychological stress that outweighs the benefit of the data.
Ignoring Intra-Individual Variability
A "normal" blood glucose level of 95 mg/dL might be fine for one person but represent a significant spike for someone accustomed to a steady 82 mg/dL. Ignoring your personal baseline leads to missed diagnoses.
The Consequences of Poor Data Literacy
When you misinterpret metrics like Heart Rate Variability (HRV), you might push through a high-intensity workout when your body is screaming for recovery. This leads to burnout, hormonal imbalances (elevated cortisol), and an increased risk of injury. Real-world situations often involve executives seeing high "stress scores" and adding more HIIT workouts to "de-stress," which only worsens their physiological strain.
Strategic Solutions and Metric Mastery
To master your health, you must focus on high-leverage biomarkers. Here is how to approach them with precision.
1. Cardiovascular Efficiency: HRV and RHR
Heart Rate Variability (HRV) measures the time variation between each heartbeat. It is the most direct window into your Vagus nerve and parasympathetic tone.
-
What to do: Measure HRV consistently at the same time, ideally upon waking or during sleep.
-
Tools: Whoop 4.0, Oura Ring Gen3, or the Apple Watch (using the "Breathe" app to force an HRV reading).
-
The Result: A high HRV relative to your baseline indicates a recovered nervous system. If your HRV drops 20% below your 7-day rolling average, it’s a signal to prioritize zone 2 cardio or rest over heavy lifting.
2. Metabolic Health: Beyond Fasting Glucose
Fasting glucose is a lagging indicator. By the time it’s high, you’ve likely had insulin resistance for years.
-
The Deep Dive: Monitor ApoB (Apolipoprotein B) and HbA1c. ApoB is a more accurate predictor of cardiovascular risk than LDL-C because it counts the actual number of atherogenic particles.
-
Tools: Services like InsideTracker or Function Health offer comprehensive panels that include these specific markers.
-
The Result: Maintaining an ApoB level below 60 mg/dL is increasingly seen by longevity experts as a primary goal for preventing plaque buildup.
3. Respiratory Fitness: VO2 Max
VO2 Max is perhaps the strongest predictor of all-cause mortality. It measures how much oxygen your body can use during intense exercise.
-
Actionable Step: Perform a Cooper Test or a sub-maximal treadmill test.
-
Why it works: Increasing your VO2 Max by just 3-5 mL/kg/min can add years to your life expectancy.
-
Practice: Incorporate "4x4 intervals"—four minutes of high intensity followed by three minutes of recovery, repeated four times.
Case Examples: Data in Action
Case 1: The "Healthy" Remote Worker
-
Subject: 42-year-old male, non-smoker, BMI 24.
-
Problem: Persistent afternoon fatigue and brain fog. Standard blood work was "normal."
-
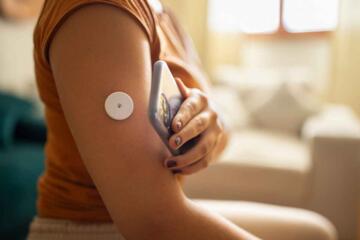
Intervention: Used a Continuous Glucose Monitor (CGM) via the Levels app for 14 days.
-
Discovery: His "healthy" oatmeal breakfast was causing a glucose spike to 180 mg/dL followed by a crash to 65 mg/dL.
-
Result: Swapped oatmeal for a protein-heavy breakfast (eggs/avocado). Fatigue vanished, and daytime glucose fluctuations stabilized within a 70–110 mg/dL range.
Case 2: The Over-Trained Athlete
-
Subject: 29-year-old female marathon runner.
-
Problem: Stalled progress and disrupted menstrual cycle.
-
Intervention: Monitored HRV and Resting Heart Rate (RHR) via Garmin Connect.
-
Discovery: RHR had risen from 48 to 56 bpm over three weeks, and HRV trended downward.
-
Result: Implemented a "deload" week and increased caloric intake by 15%. Within 10 days, HRV returned to baseline and performance metrics improved.
Health Metric Reference Table
| Metric | Optimal Range (General) | Why it matters | Recommended Tool |
| Resting Heart Rate | 45–60 bpm | Indicates cardiac efficiency | Oura, Whoop, Fitbit |
| HRV (Trend) | Upward / Stable | Nervous system recovery | Apple Watch, Whoop |
| HbA1c | 4.8% – 5.4% | 3-month average blood sugar | Blood Panel (LabCorp) |
| ApoB | < 80 mg/dL (Lower is better) | Best predictor of heart disease | InsideTracker, Function |
| Sleep Efficiency | > 85% | Quality of restorative time | Eight Sleep, Oura |
Common Pitfalls and How to Avoid Them
Mistake 1: Comparing your stats to others.
Your HRV might be 40 ms while your friend’s is 100 ms. This does not mean they are "healthier." HRV is highly genetic and age-dependent. Only compare your current data to your own historical trends.
Mistake 2: Ignoring the "Subjective" for the "Objective."
If your watch says you had a 90/100 sleep score but you feel exhausted, trust your body. Sensors can be fooled by high heart rates during vivid dreams or movement.
Mistake 3: Single-point testing.
A single blood pressure reading at a doctor's office is often skewed by "white coat syndrome." Use a home cuff like the Withings BPM Connect to get a 7-day average for true accuracy.
FAQ
How often should I check my blood biomarkers?
For most healthy adults, a comprehensive panel once every six months is sufficient to track the impact of lifestyle changes. If you are actively correcting a deficiency (like Vitamin D or Iron), re-test every 90 days.
Is a high VO2 Max only for runners?
No. High VO2 Max correlates with better mitochondrial function and cognitive health. Even if you prefer strength training, maintaining a baseline level of aerobic capacity is vital for longevity.
Can wearables accurately track sleep stages?
Wearables are roughly 60-80% accurate at distinguishing between REM, Deep, and Light sleep compared to clinical polysomnography. Use them to track trends in Deep sleep duration rather than exact minutes.
Why does my weight fluctuate so much daily?
Daily weight changes are usually water retention, glycogen storage, or inflammation, not fat gain. Use a "smart scale" like the Withings Body Comp to track the 7-day moving average and body composition (fat vs. muscle) rather than the raw number.
What is the most important metric for heart health?
While blood pressure is critical, ApoB is becoming the gold standard for assessing actual cardiovascular risk and the likelihood of lipid-driven arterial issues.
Author's Insight
In my experience, the most transformative thing a person can do is stop looking at metrics as "grades" and start seeing them as "fuel gauges." Early in my journey, I obsessed over hitting a certain sleep score, which ironically kept me awake. Now, I use data to validate my intuition. If I feel "off" and my HRV confirms it, I have the data-backed permission to rest. My best advice: pick three "anchor metrics" (like RHR, HbA1c, and VO2 Max) and ignore the rest until you’ve mastered those.
Conclusion
To move from passive tracking to active health management, start by establishing your baselines. Over the next 30 days, focus on one variable—sleep, movement, or nutrition—and observe how it shifts your RHR and HRV. Consistency is more valuable than complexity.
Invest in a high-quality blood panel that includes ApoB and Insulin, and use a wearable to monitor your recovery. When the data shows a dip, respond with lifestyle adjustments rather than frustration. True health mastery is the ability to read the body's subtle signals before they become loud problems.